Hepsia Stats Manager
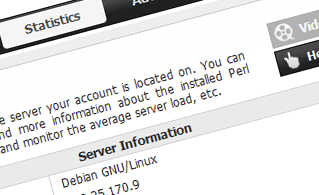
Server Information
 This section will give you exhaustive information about the hosting server your web hosting account is located on. You can see the Operating System, the physical IP address and the current PHP/Perl/MySQL versions used, find more info about the currently installed Perl modules and the POP3/IMAP and SMTP mail servers, monitor the server load, etc.
See Server Information here
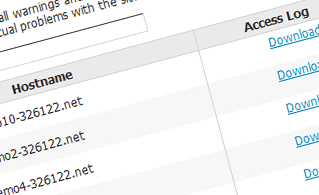
Access & Error Logs
 This section allows you to monitor the access and error log files for the web sites hosted in your account. An access log represents a list of all the files uploaded to your site, including text files, image files, video files, etc. that your visitors have requested to access. The error log, on the other hand, maintains a history of all warning and error messages related to your site and helps you prevent any eventual issues with the web site's availability.
See Access & Error Logs here
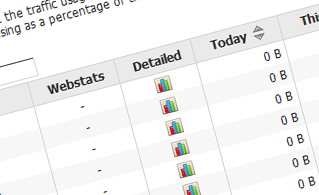
Traffic Statistics
 This section offers you exhaustive, up-to-date information about the visitors to your web site. You can pick between two popular website stats tools - Webalizer and Awstats. They offer exhaustive information about the number of hits, visits and page requests on a daily and monthly basis. You can find stats for all the web sites hosted in your account.
See Traffic Statistics here
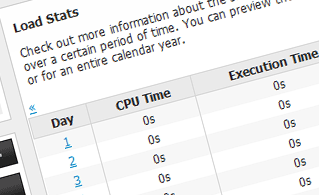
CPU Statistics
 The web server's CPU is used to deliver your webpages to your visitors. The more complex and resource-intensive your sites are, the more CPU time will be required. This section allows you to keep an eye on your CPU usage. You should do something to optimize your sites if the CPU time quota has been reached. You can see detailed stats for each day and month or for an entire calendar year.
See CPU Statistics here
| SHARED HOSTING | DEDICATED SERVERS |
| Unlimited storage | 240 GB storage |
| Unlimited bandwidth | 10 TB bandwidth |
| 1 website hosted | Unlimited websites hosted |
| 30-Day Free Trial | 24/7/365 support |
| start from C$6.94/mo | start from C$165.01/mo |